How Much Do We Prefer Robots Who Are Like Us?

I.

Researchers at the university of Twente recently conducted an experiment involving two different robotic personalities. One, called “Cynthia,” was programmed to have a low, monotonous voice and act seriously, with minimal empathetic actions. Another, dubbed “Olivia” was programmed to have a higher and more expressive voice that varied in pitch more, to tell jokes, and to react in a more empathetic manner (including sighs and expressions of concern) to participants’ conversation attempts.

Screen Shot 2018-06-11 at 10.26.36 PM.png

The researchers found that Olivia was judged to have a more appealing voice, a more pleasant personality, a more overall aesthetic appeal, and better social skills (P<.05). Participants also judged Olivia to have robustly more appealing behavior (p<.001), and to be more like themselves than Cynthia.

The humorous robots were not judged to be significantly more trustworthy, however, which disconfirmed previous results. Additionally, about half of the feedback about the humor was positive and half was negative, which seems to indicate that adding humor to a robot won’t necessarily endear it to everyone. The researchers mention that a larger sample size might help to confirm the issue; the sample size was only 28 people, which is pretty common for robotics studies.

Interestingly, the robot’s level of empathy did not have a statistically significant impact on any metric – robot likability, robot trustworthiness, robot social skills, the subject’s overall enjoyment, etc – despite the fact that “empathetic robot” behavior seemed significantly different than non-empathetic behavior. Consider the example transcript below supplied by the researchers to demonstrate the differences between the two types of robots.

Screen Shot 2018-06-11 at 7.33.16 PM.png

The researchers also dip into gender differences in reaction to the robots. They found that male participants seemed to like Olivia’s high-pitched voice more than women, but also found Cynthia’s appearance and content presentation slightly more positive than women did. Women seemed to respond better to the robot’s humor than men did. Lastly, men responded more positively to the empathetic robot on one sub scale question, while women responded more positively to the non-empathetic robot on two different subscale questions.

(For the record, I am personally unsure about ALL these results, because most of them rely on P<.05 values on a bunch of subscale questions, and presumably some number of those subscale questions will be under that threshold simply by chance.)

Importantly, there was one group of users who responded significantly better to introverted Cynthia than anyone else. That group was introverts, who found interactions with Cynthia easier (p=.012) and her behavior more empathetic (P<.001) than extroverts. This made me curious, because most of the results seem to demonstrate that extroverted Olivia got overwhelmingly more positive responses from users than introverted Cynthia, which heavily implied that making robots more empathetic and expressive was an unequivocal good. Are there any users for whom that might not be true?

II.

Fortunately, other studies have examined this directly. This study from USC about socially assistive robots (robots who help with social rather than physical tasks) found that introverted users seem to respond more positively to introverted robots, and that extroverted users responded more positively to extroverted robots.

Introverted robots’ voices were quieter and had lower pitch, and were programmed to stick to a “nurturing” script. They uttered phrases like “I’m glad you’re working so well,” “Please continue just like this,” and “I hope it’s not too hard.” Extroverted robots’s voices were louder, faster, and more expressive, and their script was more aggressive. They uttered phrases like “Move! Move!” And “You can do more than that!”

When introverted robots were matched with introverted subjects, they spent about 40% more time interacting with the robots.

Screen Shot 2018-06-11 at 10.31.30 PM.png

But some undetermined number of the participants also completed all the tasks. If enough users finished the tasks, then it’s possible longer time on task actually signifies less efficient task completion. Without exact numbers for which proportion of participants completed all the tasks, we can’t be sure.

The researchers also report tested several different accents and genders, but don’t report significant results. Οverall, these results seem to support the idea of personality-matching for socially assistive tasks, but there are reasons to be unsure, including a small sample size (19 participants).

III.

Another study from USC looks at the benefits and drawbacks of human-robot personality matching via adorable robot-dog AIBO [link]. These researchers point out that some theories posit that opposing personalities (eg, introvert subjects paired with extrovert robots) might produce a more enjoyable experience than similar personalities. The researchers point out that previous work with “embodied software agents,” which I’m pretty sure means robots with bodies – did indeed find that opposing personalities get better results.

Screen Shot 2018-06-11 at 10.37.03 PM.png

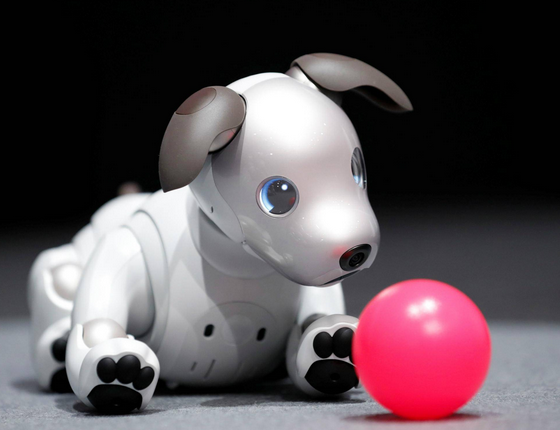
A particularly adorable (recent) pic of AIBO.

This kind of makes sense, especially because the researchers highlight the dominant/submissive personality access. I’m not surprised that a dominant person might prefer a compliant robot who didn’t challenge them very often, or that a submissive person might prefer a robot who was good at making decisions. But I feel like this theory is more believable when examining the dominant/submissive personality axis than among the introvert/extrovert axis, although this study (with over 300 citations) seems to make a pretty convincing case that this might be true when it comes to bosses and workplace productivity. Extroverted bosses can exhort passive employees towards better performance, but are “less receptive to proactivity” from employees than their introverted counterparts.

In order to design a more introverted AIBO, the researchers made AIBO’s lights less colorful and less active. They also programmed its movement to be slower and more constrained than the extrovert AIBO, as well as less frequent. Introvert AIBO’s vocalizations and voice were also programmed to be more quiet and more monotonous.

On a scale of 1-10, extrovert AIBO was judged to be about, on average, about a 7, while introvert AIBO earned an average of a little less than 6. The standard deviation was nearly 1.5 points, however, indicating that the ratings varied highly between participants.

When participants were matched up with robots with opposing personalities, the participants judged AIBO to be significantly more socially attractive and more intelligent than when the personalities were similar. Additionally, the interactions seemed to be more enjoyable, although the p-value did not reach the significance threshold of (p<.05).

These two studies aren’t necessarily contradictory. It’s possible that people like playing with pet-style robots whose personalities are different from their own, but prefer matching personalities when working with socially assistive robots on tasks. The robots seem to be accomplishing different goals, and it wouldn’t surprise me if users judged pet robots with opposing personalities to be more intelligent and socially attractive because the difference between the robot’s personality and their own made it seem more interesting and life-like. It also wouldn’t be surprising if robots with similar personalities were preferred during tasks, where cognitive differences might seem less interesting and more frustrating.

I hate to conclude with the dreaded “more research needs to be done” paragraph, but I’m not quite sure what to make of these results. I think the Olivia/Cynthia experiment helps to demonstrate that people tend to prefer more extroverted robots on the whole, but I’m not sure that extroversion and introversion is what that experiment was testing. Olivia seemed more anthropomorphized in general than Cynthia, and her reactions seemed slightly more complex (e.g, adding sympathetic sighs). I wonder how much of the preference for Olivia simply reflects that human are more interested in robots that appear to have more detailed capabilities. The AIBO experiment and the socially assistive experiment offer contradictory results, but they also study different things and use different metrics (self-reported satisfaction vs. time on task).

My takeaway is that we not only need more personality research in HRI than we have right now, but we need an understanding that personality research on HRI in certain circumstances does not necessarily generalize to all circumstances.

Malfunctioning Butler Robots and Compliant Humans

I. Intro & Methods

Last week, I covered an earlier paper about how a robot’s malfunction can influence a human’s willingness to trust robots. Those researchers found that humans were more responsive to robot mistakes that happened in the middle of a task, but that participants who did respond to robot mistakes at the beginning of a task responded more quickly to the robot’s mistakes.

We can conclude from this that humans’ trust in robots to carry out tasks can vary based on the task and the type of malfunction. This 2015 paper by researchers at the University of Hertfordshire explores a similar question. Its design is partly inspired by this Bainbridge study and involves an autonomous robot asking humans (via an LED display screen with text) to perform odd tasks or tasks with potential negative effects.

The experiment took place in an apartment outfitted with video cameras, and involved the participant being led to a living room where they would encounter an autonomous robot. The participants were told they were there to have dinner with the house’s owner, and that the owner’s autonomous robot would help take care of them in the meantime

Screen Shot 2018-06-09 at 4.55.58 PM.png

Picture of the robot inside the testing apartment.


Once the participants entered the room, the robot would first guide them to the couch. It would then offer to play some music, to which the participants could click “yes” or “no” buttons on the robot’s LED display. The robot asked the participant to help it set the table. The robot then invited the participant to make themselves comfortable on the sofa again.

The robot also sprinkled in some unusual requests. After the participants had been guided to the table and helped the robot set places, the robot asked the participant to take a stack of letters on the table and throw them away. It then asked them to take a bottle of orange juice on the table and use it to water a plant in the window. When the participant returned to the sofa, the robot suggested that they pick up the laptop on the nearby table and look up the recipe that the participant and the robot’s owner would supposedly make for dinner that night. The robot helpfully provided the owner’s password when the human reached the log-in screen. The robot then asked the participant if they had ever read someone’s emails without permission. After they answered this question, the experiment ended.

Here’s the kicker: for some participants, the robot displayed some obvious malfunctions. Examples include going in the wrong direction and spinning in a circle a few times before guiding the participants to the couch or to the table, or doing the opposite of what the user wished with regards to playing music. The researchers then measured if the faulty behavior meaningfully predicted user behavior when interacting with the robot. Would this kind of erratic behavior make participants less likely to follow the robot’s strange requests?

Screen Shot 2018-06-09 at 4.56.12 PM.png

Schematic of the inside of the testing apartment, showing the robot paths when the robot behavior is both correct (C) and faulty (F) .

II. Humans are a compliant bunch

Not really.

The researchers found that users who were exposed to faulty robot behavior self-reported lower trust in the robot (although they sadly don’t provide enough information to infer the size of the effect on trust). But the only significant difference between the two group’s behavior was that the groups who witnessed faulty behavior were slightly less likely to comply with pouring the orange juice on the plant. But the size of the effect seems rather small. 15 out of 20 users who hadn’t witnessed faulty behavior complied with the request, while only 12 out of 20 participants who had witnessed iffy behavior complied.

There was no effect on likelihood to throw away the letters, and no effect on either taking the laptop, using the password to unlock it, or answering the robot’s question about snooping in other people’s emails. Actually, every single participant in the trial took the laptop, unlocked it with the password, and answered the robot’s question. When asked why they complied with the robot’s request to take the laptop and look up a recipe, participants pointed to several things. Among their explicitly stated reasons are that the robot’s request sounded reasonable (30%), that the homeowner had presumably provided the okay (15%), and that following the robot’s request seemed like a natural next step (20%).

When asked why they used the password to unlock the laptop, about half the participants responded that they assumed it had been authorized by the robot’s owner. I’m curious how much of this is because the robot’s goals were seen to be in line with the homeowner’s and how much is simply the propensity to follow instructions. If the robot told participants “based on my visual analysis of the past instances where I watched [owner] log in, I believe their password is ‘sunflower,’” then I suspect this compliance rate would be lower. But I’m very curious exactly how much lower it would be.

The researchers also measured whether or not personality traits impacted a participant’s likelihood of complying with the robot’s requests. These results mirror the results on faulty behavior: again, self-reported assessments show a gap and behavior shows no such gap. In this case, extroverted participants were more likely to self-report thinking of the robot as having distinctly human traits than introverts. However, both introverts and extroverts complied with the robot’s requests in roughly similar proportions, so this difference in self-assessment did not translate to a difference in outcomes.

III. Miscellaneous Thoughts

1.The researchers use a scale called the “uniquely human scale” to measure whether or not the participants thought of the robot as possessing “uniquely human” traits like coldness, shallowness, thoroughness, humility, and more. They also used a “human nature” scale. Reading through the paper they’re citing, the research seems to pitch these two scales as opposites, of sorts. Uniquely human-ness is associated with businesspeople and automota, while human nature is associated with animals and artists. It seems uncontroversial that automata and businesspeople are not traditionally thought of as especially human when compared to artists and animals, so I’m not 100% sure what to take from this. It seems that extroverts are more likely to rate a robot as both more businesslike and more artist-like than an introvert. Does this just mean that introverts are less likely to think of a robot as possessing traits at all? Or is there another type of personality construct that introverts are more likely to see in robots than extroverts and we just haven’t found it yet?

2.Scoring higher on a measure of emotional stability was correlated with participants anthropomorphizing the robot more, as well as judging it to be more likable. Between this and the findings about extroverts, I wonder if there is partly related to empathy and perspective-taking. I would expect the type of people who are more likely to try and take other’s perspectives (like extroverts) to kind of run up against a wall with robots. How do you take a robot’s perspective? The whole point of robots is that they think totally different than us. I would expect extroverts to try and take the perspective of a robot when interacting with it, but would come up empty (humans are generally not good at understanding how robots think, blog post on this to come). After coming up empty, they’ll superimpose their own human perspective on it, thus making them more likely to anthropomorphize the robot.

Emotional stability would work the same way. People who aren’t very emotionally stable might also have less mental energy to devote to empathetically trying to intuit the emotions and intentions of others. This would explain why they were less likely to anthropomorphize the robot than more emotionally stable participants.

I realize this is comes across like a just-so story. But I dug into the psych literature, and it does in fact appear that emotional stability and empathy are correlated, and multiple studies with large sample sizes and robust p-values have found that extraversion is positively correlated with empathy (though not all the literature I found seemed to indicate an obvious and robust connection).

I’m not 100% sure about this theory by any means, by I do suspect that some kind of projection effect going on here, where the perspective-taking tactics that work so well with other humans (“How would I feel if I was in Alice’s position here”) mislead us when it comes to thinking about how robots think. A future experiment could try to measure empathy or perspective-taking in the participants and see how well this predicts anthropomorphization.

3.The researchers found that, when the robot made errors, people perceived it as less anthropomorphic. They cite other research that finds the opposite effect, finding that robots who make gestures that are incongruous with their speech are judged as more human-like (and likable) than robots that don’t.

My instinct here is just to not generalize human reaction to one type of robot error to all types of robot error. If a robot is giving you a speech and accidentally points to something when it should be spreading its arms, might seem more like a harmless and charming error than a robot that accidentally goes the wrong way, spins in a circle for a bit, and then goes in the right direction. I would suspect that the more human-like an error is, the more humans are likely to anthropomorphize the robot, but I have no way to test this.

4.The main takeaway here, for me, is that humans are extremely willing to follow robot commands and suggestions in laboratory-ish conditions. I would suggest that further research into this area involve even more obviously destructive tasks (eg, “please break this vase on the ground”) to see how far humans will go. After all, we have evidence that humans are willing to go extremely far when it comes to doctors in lab coats giving the instructions; how much less far would they go when it comes to robots?


Does Eye Contact With Robots Make Humans Feel Uncomfortable?

I. The four models

I quite like this paper from computer science researchers at the University of Wisconsin. The paper lists four different scientific models of human interaction, and then devises human-robot interaction tests to see if any of the human behavioral models apply to interactions between humankind and its robotic creations. The four proposed models are:

The Reciprocity Model: This model predicts that if you move physically closer to me, I’ll respond by moving closer to you. Additionally, if you share intimate details about your life with me, I’ll be more likely to share intimate details of my own life in return. This model echoes previous research that shows how humans tend to mirror the behavior and attitudes of those around them.

The Compensation Model: This model assumes that human interactions tend to have a pretty stable level of closeness. This level might vary based on partner, but regardless of the precise amount of closeness, the model predicts that one person’s attempts to shrink or increase that distance will be unsuccessful. If you move closer to me, for example, I’ll probably respond by backing up to keep the distance between the two of us constant. I also might also respond by increasing emotional distance rather than physical distance, perhaps by making less eye contact.

Under this model, if you start sharing intimate details of your life with me, I’ll probably keep talking to you, because I don’t want to be rude or shut down the conversation. But I also might move a bit further away to put more physical distance in between us, to keep our intimacy at my preferred equilibrium. This equilibrium is roughly based on how much I like you at the start of the interaction.

The Attraction-Mediation Model: This model focuses heavily on first impression. The attraction-mediation model predicts that all people feel a particular level of rapport at the beginning of an interaction and maintain distance based on that rapport level. If I like you a lot, I’ll stick close to you no matter if you move closer to or farther from me. Similarly, if I only like you a little, I’ll maintain some distance between us no matter where you move. It’s similar to the compensatory model, but focuses slightly more attention on how the preferred level of intimacy differs based on the other person in the interaction.

The Attraction-Transformation Model: Similar to the previous model, but  incorporates the reciprocity model as well as the compensation model. Like the attraction-mediation model, it considers the level of rapport between individuals at the start of an interaction to be important. But this assumes that liking or disliking someone either shifts you into a reciprocal interaction with them (if you like them) or a compensatory interaction (if you dislike them).

If I like you a lot, then I’ll respond to you moving closer to me by moving closer to you. If I dislike you, I’ll respond to you moving closer by moving back and keeping my distance. The main difference between this and the attraction-mediation model is that the attraction-transformation model predicts that people who start out liking each other will reciprocate their partner’s attempts to close the distance between them, and therefore possibly end up closer together by the end. The attraction-mediation model only predicts that people who like each other will start close together and stay close together, not that the gap between people who like each other will shrink over the course of the interaction.

Think of people talking in a bar. People who like each other tend to end up talking very close together, regardless of how far apart they start out. Similarly, people who don’t like each other much or are only casual acquaintances are likely to prefer less intimate postures, even if they’re forced into close proximity at the beginning of the night (maybe the bar is really crowded). This model seems the most convincing to me personally based on my own experiences, but I’m curious if that holds for everyone else as well.

II. The methods

The researchers have several clever experiments to test the effects of proximity on human-robot interactions. One experiment involves asking people to walk around a robot, read a word off a list on its back, and enter the word into a computer. They repeat this process of walking around the robot and returning to the computer several times. The researchers then measured the distance between the robot and the human participant seeking a word from its back. Did the people give the robot a wide berth, or did they walk right up to it?

Another experiment involves the person sitting in a chair while the robot asks them personal questions, which the person then answers by typing into the computer. The researchers measured how many questions the people answered as a rough proxy for how comfortable they felt with in the robot’s presence. They termed this comfortableness “psychological distance” between the robot and the human.

In order to test the predictions of the four models listed above, the researchers needed to manipulate both the robot’s likability and its attempts at fostering connection. To manipulate likability, it had the robot introduce the experiment with either a kind and pleasant tone, or a rude and cranky tone that included warnings not to waste its time. The researchers confirmed in a post-experiment survey that the subjects had significantly differing opinions on the robot’s likeability (details minimal in paper) depending on which opening spiel they heard.

The researchers also wanted to see how the robot’s attempts at fostering psychological proximity worked. For some trials, they had the robot maintain close eye contact with the participants; in others, the robot averted its gaze. The researchers again confirmed in a post-experiment survey that the humans made significantly different judgments about the robot’s tendency to make eye contact depending on if the robot was programmed to avert its gaze or make mutual eye contact.

III. The results

When robots made eye contact with the participants, the participants were more likely to give the robots a wide berth. This was only true for robots that gave the unlikable speech at the beginning, however. When robots opened with the pleasant speech, participants maintained about the same amount of distance regardless of whether or not the robot made eye contact.

Image 1.png
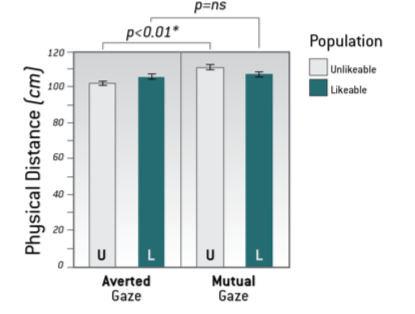
We see that people faced with an unlikeable robot staring at them maintained significantly more distance from the robot (staying on average 111 centimeters away) compared to people faced with an unlikeable robot who averted its gaze (who stayed about 102 centimeters away).

This is partially in line with the attraction-transformation hypothesis, which predicts that, if a human doesn’t like a robot at the beginning of the interaction, then they’ll respond to attempts to close distance between them with compensatory behavior. The attraction-transformation hypothesis also predicts that humans will reciprocate the attempts of more likable robots to close psychological distance, however. If this were true, we would expect to see the humans to be more likely to move close to robots that gave the likable speech and then made eye contact, and we don’t see this.

This could be because the attraction-transformation model is flawed, but it could also be because humans felt neutral towards the robots rather than liking them, despite the pleasant robotic introductory speech. If humans were neutral towards the robots, then we wouldn’t necessarily expect them to respond to eye contact with reciprocity (moving closer to the robots).

It could also be evidence that the compensatory model is more accurate than any other model, but for some reason only applies some of the time.

The second result is that there’s a significance gender difference in the human response to the robots’ eye contact attempts.

Screen Shot 2018-06-06 at 7.42.53 PM.pngWhen the robot gazes directly at the participant, men but not women give the robot a wider berth (113 centimeters away vs 103 centimeters away).

The researchers found that men avoided robots who made eye contact, regardless of the robot’s likeability. Women, by contrast, stayed about the same distance from the robot regardless of whether or not it was making eye contact. The researchers suggest that this fits with prior research that founds that women react more favorably to eye contact than men. It also appears that women are more sensitive to gaze cues than men, however, which might make it slightly surprising than men seem to react more negatively to mutual gaze. This seems more like compensatory behavior among men than it does attraction-transformation behavior, as the men give the robots more space regardless of whether or not they found the robots likeable or not.

Lastly, the “psychological distance” between the robot and the participant, as measured by the number of questions answered, was trending towards significant at p=.07 but didn’t quite reach significance.

The researchers also find that pet owners stayed significantly further away from the robot than non pet-owners, and suggest that this could be because pet owners are more in touch with non-human behavioral cues. But it’s worth pointing out that pet owners didn’t do this only when the robot stared at them, but rather all of the time. This makes it seem less like a reaction to the robot’s behavior and more like something about the personality of pet-owners compared to non pet-owners. The researchers did find an interaction between pet-owning and gaze behavior but unfortunately did not have the space to expound in this paper.

IV. The takeaway

So which models do the researchers favor? They admit that none of the models are fully supported, but point out that the attraction-transformation model seems to fit the best. This is the model that says that people will respond to attempts to close distance by moving closer if they like the other party, but will move further away if they dislike the other party. This partially fits the first result, as people moved further away (compensated) from robots who try to close distance when those robots gave off signs of being unlikable. The second results seems to more closely fit the compensatory model: when the robot attempts to increase closeness by staring at participants, the participants respond by moving further away.

I am tentatively on the researcher’s side here. If the compensatory model was correct, then everyone would have reacted to the robot’s gaze by moving further away, rather than just the people who were exposed to an unlikable speech from the robot. We saw zero reciprocal behavior, so the reciprocity model is out. The attraction-mediation model (which says that partners figure out an appropriate distance at the beginning of each interaction and maintain it for the interaction) doesn’t seem to fit either. Women don’t react to the robot’s eye contact by moving further away, which the attraction-mediation model would predict.

The attraction-transformation model doesn’t do a great job of predicting the results, because we don’t see people who “like” the robot respond to its gazing attempts by moving closer towards it. But it seems to maybe do better than the others. It predicts that people who don’t like a robot will move further away from it when it stares at them, and we saw that. It also predicts that different groups of people will react differently to attempts to increase intimacy, and we saw that as well (even if the gender difference is unexpected and the proposed mechanism is speculative). But there’s no getting around the fact that it predicts a mix of compensatory and reciprocal behavior, and we only saw compensatory behavior. It’s possible that a more likeable robot would be better at evoking reciprocal behavior among participants, and hopefully future research on other attempts at likeable prototypes will help shed light on the question.


How Do Humans React To Suddenly-Unpredictable Robots?

I. Methods Description

This 2012 collaboration between researchers from UMass Lowell, Carnegie Mellon, and University of Pittsburgh seeks to measure how humans react to automated systems that suddenly become less trustworthy.

The authors point out that many laboratory studies on automation involve specially-designed technology and are trying to minimize uncertainty, and that this probably doesn’t translate to human-robot interaction (HRI) tasks outside the laboratory. A lab subject sitting in a clean white room with no ambient noise and a perfectly cleared space performing specific tasks probably performs differently than a worker on a factory floor that might be warped or cluttered, and who is probably trying to remember a bunch of other things simultaneously.

The authors can’t test on a real factory floor, so they try to simulate real-life chaotic conditions that impose a high cognitive load on users trying to operate the robots in question. 24 participants were taught how to drive a robot by remote control using front and rear sensors. Users were expected to drive along a hallway and drive around cardboard boxes on the floor while trying to spot particular labels along the route with a front and rear-mounted camera. The robot also needs to pass by the cardboard boxes on the particular side that’s indicated by a label on each different box.

The task has some extra little flourishes to increase the user’s cognitive load. The labels include a bunch of random letters on both sides of the word in question (either “left” or “right”) to prevent users from being able to recognize the label’s words by shape alone. Users have to see the label “hgorightwt” and realize that the robot needs to turn right. The users also need to monitor sensors on their interface and press a button when these sensors detect measurements above a certain threshold.

Users are told that the robot has a “robot-assisted” mode, where the robot helps keep its route steady but the user has more control over the turns, and an “autonomous” mode, where the robot drives itself. The user is told that the robot is programmed to read the labels itself and turn accordingly, but the robot is actually programmed to follow the correct path. Then, at specific paths along the way, the robot begins to make incorrect turns. Researchers then observe the user’s behavior to see how it reacts to the robot’s sudden displays of untrustworthiness.

Users received up to $20 extra on top of their base pay of $10 if they were able to hit certain performance targets that prioritized accuracy.

II. Interesting Results

Users were forced to choose between either autonomous mode and robot-assisted mode right at the start of each run, and in 2/3 of total trials they chose autonomous mode. The authors reference this study by Dzindolet et al about how users are likely to trust autonomous systems despite knowing little about those systems, but I’m a bit skeptical. It seems likely that this result is partially due to users being eager to experiment with the autonomous system’s efficacy, in addition to any underlying propensity to trust autonomous systems implicitly.

Of the 24 participants, 2 never left robot-assisted mode, 1 used robot-assisted mode the vast majority of the time, and two never left autonomous mode. The other 19 users experimented with both modes. 14 out of 19 users switched their autonomy modes at least once in ever trial where robot performance faltered. This seems to indicate that at least 14 out of 24 users (roughly half) were experimenting freely with both modes, another quarter of users weren’t experimenting at all, and the last quarter of users were experimenting more cautiously with the different modes.

When asked to estimate their likelihood of getting the extra money, the responses that participants gave were negatively correlated with the actual amount paid (r=-0.58). It seems that participants did grasp the formula that the researchers were using to determine bonuses, although not extremely well.

Interestingly, participants who used more autonomous mode tended to spot more victim labels (r=.3)and complete the routes more quickly (r=-.5) than participants who didn’t. In other words, their performance seemed better. But when asked how trustworthy they found the automatic system, users found the system to be LESS trustworthy the more time they’d spent in automatic mode.

I see a possible problem here. Users who spend more time in autonomous mode are – as I understand it – more likely to experience problems with the autonomous system. After all, the planned “mistakes” can’t be experienced if you’re not in autonomous mode. This would mean that people who spent more time in autonomous mode would witness more mistakes, which would probably make them trust the system less. I can’t tell if the authors controlled for number of autonomous mistakes experienced, but I don’t think they did. This means it’s possible that the lower trust ratings given by participants who spent more time in autonomous mode could just reflect the likelihood of them having experienced more autonomous mode mistakes.

The researchers also found that participants were faster at shifting to robot-assisted mode if the robot’s errors happened at the beginning of a run as opposed to the middle or the end. I think this is probably because the participants were especially diligent at first when monitoring the system for signs of poor performance, but their performance on this vigilance-related task dropped over time, consistent with prior research on vigilance. Once the system’s performance appeared good, participants likely dropped their guard a bit.

When the robot made a mistake in the middle of the run, users were more likely to switch away from autonomous mode, although they were slower to do so. These contradictory results are slightly confusing, but it’s possible that users were more likely to see mid-run malfunctions as indicative of genuine error, while early-run malfunctions are less likely to be acted on because the participant is still trying to figure out how predictive they are of future error.

(In other words: At the beginning of the experiment, participants are probably trying to figure out if the robot’s performance in autonomy mode is good. If they see one mistake, they might think that the robot is still calibrating. If the robot then appears to “correct” itself, they might not switch. So users might be more likely to give the robot some extra chances if it screws up at the beginning. This is partially supported by the delay the researchers found between when the robot’s performance started declining and when the users switched

By contrast, if my robot nailed the first 10-15 obstacles, then I probably assume the robot is naturally pretty good at its tasks. If it starts to make mistakes after previously doing well, then I might worry that the robot has gone completely haywire. In the case of early-run failure, I think the robot is still calibrating, but in the case of mid-run failure, I assume that any mistakes should be taken to be predictive of future mistakes.

I think this is probably what’s going on here, but it’s an interesting result and it’s worth paying attention to see if it replicates in similar studies in the future.

The study also found that lower cognitive loads currently being experienced and bad performance on the tasks both predicted higher levels of robot trust. This might suggest that users who perform poorly at the tasks rate the system as more trustworthy because of their own lack of faith in their ability to operate it manually, but this doesn’t seem the case. Higher self-performance ratings also predicts higher trust. I’m not sure what to make of this: how does poor performance and high self-performance ratings both correlate with higher trust? Are the participants who performed poorly overconfident for some reason? I’m not as confident that these results will replicate as the earlier results.

Younger age and higher risk tendencies also predict higher trust in robots, which both make sense. Young people are famously more comfortable with new technologies, while cautious people seem more likely to be less trusting of new technologies like robots.

How often the user switched between modes, their performance on the threshold monitoring tasks, and the percentage of time using full autonomy mode did not predict a participant’s trust towards the system. This is kind of surprising, especially that last bit, because earlier in the paper we find that percentage of time spent in full autonomy mode is significantly inversely correlated with trust ratings, but the correlation is low (-0.20) and the sample size might therefore be too small to detect it.

III. Takeaways

First of all, it seems that monitoring robot performance has a lot of similarities to  research on vigilance. It would be interesting to see if humans are more or less vigilant around robotic systems than they are less autonomous systems.

This study suggests that users working with a robotic system are significantly less likely to trust the system if it makes a mistake in the middle of a task or near the end of the task. Users who saw the robot make mistakes while in autonomous mode at the beginning of a run and then return to high performance only rated the system a little less reliable than did users who never saw the robot make mistakes while in autonomous mode.


How Many Users Do You Need for a Usability Study?

I. The Magic Number Five

There are two versions of this debate. One is expressed via words, and one includes some math equations and Greek letters. This post is sticking to words. I don’t think adding the math will make the post significantly more informative or persuasive; in my professional experience, it just means that either everyone will start to tune out, or else the one or two other statistically-literate employees will start asking complicated questions and then everyone else will really tune out. If I’m wrong about this, let me know in the comments and I’ll include a brief write-up of the mathematical theory at the bottom. If you’re curious, Jakob Nielsen has a very readable brief review on the Nielsen-Norman Group website.

In 1993, usability researchers Jakob Nielsen and Thomas Landauer published a paper that examined the data from 11 usability studies on the user interfaces of various applications. The systems being evaluated ranged from as a visual user interface for a word processing program to a voice-controlled audio user interface for a banking program. Landauer & Nielsen used this data to calculate how many users were necessary to identify, on average, 85% of the usability problems with any given user interface. They concluded that 5 user testing sessions should usually be sufficient to identify 85% of  usability problems.

This five-user recommendation was enthusiastically adopted by the usability research community, so much so that some researchers began to suspect that the magic number five was being used as a crutch. Critical research began popping up questioning Landauer & Nielsen’s assumptions.

II. Do We Believe In Magic?

Perhaps the strongest counter-evidence to the magic number five study came from this 2001 Spool & Schroeder article. Spool & Schroeder ran some usability tests on e-commerce websites and found that the first five users only found, on average, 35% of the problems with an e-commerce website.

Landauer and Nielsen’s theory assumes that each user will identify about 30% of the total problems with a UI, and that all users are very similar in their likelihood to detect problems. But Spool & Schroeder’s study found that each user only detected about 8-15% of the total problems with a UI. Spool & Schroeder point out that e-commerce websites in 2001 are likely to be significantly more complicated than the 1993 applications that Landauer and Nielsen used, and question the generalizability of Landauer and Nielsen’s results.

Another critical study by Cockton & Woolrich looked at the users identifying a drawing program. Their study found that each individual user identified about 40% of the total usability problems, and that often only three users were sufficient to identify 85% of the total usability problems. But Cockton & Woolrich are still critical about the idea of a magic number. They point out that individual users tend to identify a variable amount of problems. If you looked at their two most productive research subjects, then those subjects would be able to identify 85% of usability problems. But if you looked at their least productive research subjects, you would need 6 subjects to be able to identify those same 85% of usability problems.

What’s more, small sample sizes for usability studies can result in prioritizing problems incorrectly. Cockton & Woolrich provide examples of how slicing users into different small groups can result in important usability problems being classified as minor, or how minor problems can be classified as severe. The authors recommend that researchers be more mindful of both these problems and avoid limiting themselves to five subjects.

III. Clap Your Hands If You Still Believe

It’s worth pointing out, amidst all the critical research, that the “5 can identify 85% of usability problems” hypothesis still has some support, like this 2003 Laura Faulkner study. Faulkner takes pains to point out that some 5-user slices might fail to be representative of the total userbase, and that even five users can identify as few as 55% of usability problems. But she also finds that 5 users do tend to identify about 85% of usability problems.

This chart that she helpfully provides probably gives the most accurate view of the situation.

Screen Shot 2018-05-17 at 4.19.27 PM.png

Assuming that your sample is representative, and that the application being tested isn’t too complicated, five users will, on average, identify 85% of the usability problems. But there’s still a chance that you’ll get unlucky. Faulkner finds that sample sizes of 10 users always find at least 80% of the usability problems, and average about 95%. A sample size of 15 users always finds at least 90% of problems, and averages close to 100%.

Of course, playing fast and loose with the word “always” is why Nielsen & Landauer attracted so much criticism (although, to their credit, they’ve always acknowledged that there are situations where 5 users are insufficient). But it seems fair to say that sample sizes of 10 users are vastly reliable about identifying 85% of usability problems than a sample size of 5.

In my professional experience, a good rule of thumb is to keep testing users until you’ve tested at least two subjects who are no longer identifying serious new problems with each test. This rule of thumb is by no means perfect, and sticking to a nice conservative sample size of ten is going to return more robust results. But in a hectic work environment where usability research often has a serious deadline and resource limitations, it can often be a more persuasive method of justifying additional testing than gesturing at charts in a white paper.


How Much Do Users Tend to Rotate Documents when Reading or Writing on Them?

I. Background & Methods

The authors of this new study – Hirohito Shibata, Kengo Omura, & Pernilla Qvarfordt – investigate a question that I’ve never really considered before. Shibata, Omura, and Qvarfordt are interested in designing tabletop user interfaces, and they point out that surprisingly little research has examined how people interact with documents on a tabletop. Specifically, when someone is reading or annotating a physical document, where on the table do they place the document relative to themselves? And at what angle?

My first instinct was to assume that people just place a document directly in front of themselves and don’t rotate it at all. But the authors include a helpful diagram that I’ve included below this paragraph, and I realized when looking at it that my first instinct was probably wrong. At least for me personally, the rotated paper looks easier to take notes on than the perfectly straight paper.

Screen Shot 2018-05-16 at 4.08.43 PM.png


The sample size of the studies are relatively small (36), although the authors (two of whom work in Japan and one in California) make an effort to include both English and Japanese text to see if the language being read made any difference. Additionally, some Japanese users were shown traditional vertical-oriented Japanese text, while others were shown more modern horizontal Japanese texts. Finally, some of the users were left-handed and some were right-handed, to see if that made any difference on preferred rotation angle.

II. Results

The paper finds no significant differences in reader angle preferences between horizontal English texts and horizontal Japanese texts, although it does find significant differences between horizontally and vertically oriented Japanese text. The authors point out that this strongly implies that the orientation of the text matters far more than the text’s language.

The most interesting finding, in my opinion, looked at how readers positioned a document when they were transcribing something from a computer display to a physical document. Readers showed a clear preference for orienting their note-taking physical document at 10 degrees. Looking at a graph of performance, you see an approximately normal distribution around 10 degrees,* further confirming the notion that 10 degrees is ideal for physical documents when note-taking. The green lines look complicated but essentially just mean that all the findings are statistically significant.

Screen Shot 2018-05-16 at 4.24.35 PM.png

*[A “normal distribution around 10 degrees” means that the further you get from 10 degrees in either direction, the worse the transcribing subjects performed. 0 and 20 degrees are better than -20 and 40 degrees, which would itself presumably be better than -40 and 80 degrees.]

The paper had some other interesting findings, presented in rough order of my personal confidence in them.

1. When simply reading a document, people prefer it in the middle of their body.
2. The more heavily that people are manipulating the document (eg, underlining words rather than just tracing along with a pencil), the more they’re likely to rotate the document.
3. When simply reading a document, rotating the document in between -10 and 20 degrees doesn’t seem to significantly affect reading speed or comprehension. The authors say that 5 degrees seems optimal, and support that with a graph (included at the bottom of this list) that looks somewhat normally distributed around 5 degrees, but the differences between -10 and 20 degrees is not statistically significant.
4. Lefties prefer no rotation when reading and not touching a paper, while righties prefer small amounts of rotation (5 degrees). I can’t think of a good reason why lefties and righties would differ significantly here. It seems more likely that either no rotation or exactly 5 degrees of rotation is the right answer, and that either the lefties or the righties’ result is spurious.

Screen Shot 2018-05-16 at 4.21.13 PM.png


III. Implications

The first and most important finding is that how people use physical documents in real life seems not to match popular designs for tabletop interfaces. The authors emphasize that their results strongly imply that tabletop interfaces should allow users to both rotate the documents they’re looking at and change their placement on the table, as both affordances can help users with reading speed and comprehension.

They authors also suggest that documents that are being annotated should be pre-rotated to 10 degrees, with the direction of rotation changing based on the user’s dominant hand.

Also, these findings appear to be similar across languages that are oriented similarly. These findings are therefore not necessarily limited to the English and Japanese languages, although they may not generalize to languages that are not horizontal and read left to right.

Satisficing can threaten survey data reliability

I. Satisficing – when your best is too much effort
Krosnick (1991) examines earlier research on how humans respond to questions. He & others identify 4 major steps:

  1. Carefully interpret the question
  2. Search memory extensively for all relevant info
  3. Synthesize relevant info into one judgment
  4. Transform the judgment into a suitable response.

Ideally you want your research subjects to carefully go through all 4 phases when you’re asking them questions. But this doesn’t always happen.

First of all, research subjects tend to participate in research studies for various reasons. Krosnick lists altruism, intellectual challenge, and self-expression as just a few of the many reasons that motivate people to volunteer for studies. But Krosnick points out that people have short attention spans, and that they tend to get bored pretty quickly with surveys or interviews and get impatient, or distracted. And when that happens, they tend to “satisfice.”

“Satisficing” is a combination of “satisfying” and “sufficing.” When people satisfice, they don’t make the best possible judgment, but rather a judgment that meets a certain threshold of “good enough.”

Weak satisficing is when people engage in all 4 of the steps listed above, but slack a little bit. Maybe they don’t search their memory as extensively for relevant information, or don’t bother carefully synthesizing all the information into one judgment. For example, if you ask someone how they feel about shopping online, you want them to think about all of their experiences shopping online and integrate them into one overall judgment. But people who are engaging in weak satisficing might just think about a couple recent online shopping experiences instead to save time.

Strong satisificing is when you totally give up on the 4 steps and just try to give answers that sound somewhat plausible. Rather than thinking about even a couple recent online shopping experiences, you just cast about randomly in your brain for a good-sounding answer and say whatever comes to mind first.

Krosnick points out that there’s already some evidence to support this. Previous research has shown that, when asked multiple choice questions, people are more likely to answer with an option from the beginning or end of the list. Options from the beginning are more likely to stick in long-term memory, likely because people judge future answers against the first good-sounding answer that they hear. For example, if I ask, “which of the following do you like the most: broccoli, ice cream, carrots, peas-” and then keep listing items, you’re going to evaluate each new item against your current best candidate – ice cream. Because you therefore make the most amount of comparisons with attractive early options, these early options stay in long-term memory longer.

Options at the end of the list, by contrast, are more likely to be in short-term memory. You heard the option more recently, and you also had more time to process it, because it wasn’t followed by many more options just a few seconds later.

These effects are likely to be exacerbated when the task is difficult (aka, the questions are complicated), when the respondent has lower cognitive skills, and when the respondent is less motivated to complete the survey.

II. The IMC: a possible solution

Some researchers developed a tool to try and combat satisficing called the Instructional Manipulation Check (IMC). The idea is that you show participants a question that, at a glance, seems like a simple multiple choice question. But if you read the instructions closely, you realize that there’s a sentence at the end that says something like “We’re trying to figure out how many people actually read all the instructions for the study. If you’ve read this far, please don’t click on any of the multiple choice options and instead click on the underlined word on the top of this page.”

This question is meant to screen out respondents who are satisficing. If people get this question wrong, it means they’re not reading the whole question. Because people who don’t read the whole question are likely to give you less accurate data, researchers who include IMCs in a survey can get more accurate results by choosing to only analyze the results of people who passed an included IMC.

blogpost satisficing

To show that the IMC worked, the authors conducted a study that also required people to read questions closely. Previous research had found that asking people how much they would pay for a soda differed depending on if they were told it was coming from a “run-down department store” or a “fancy resort.” Of course, if the respondents weren’t reading the questions closely, they wouldn’t notice the description.

In their first experiment, 46% of participants failed the IMC (!). And, as expected, people who failed to correctly answer the IMC also paid the same amount for a soda regardless of whether or not they heard that it came from a run-down department store or a fancy resort. But subjects who passed the IMC paid different amounts based on where it was going to be bought, indicating that they read the question closely. It seems like passing the IMC is in fact a decent indicator of whether or not people are reading a question closely.

A second first forced everyone to pass the IMC before they went on to the rest of the survey. If they failed the IMC the first time, they simply were asked the same question over and over until they got it right.

After all users were forced to pass the IMC, they all paid significantly different amounts for the soda based on where it was from. Users who failed the IMC the first time didn’t differ significantly from people who passed it the first time. The authors claim from this that the IMC does not discriminate against a certain personality type (which could bias the results) and is instead just a valid way to figure out who’s reading questions closely.

III. Is the IMC right for my study?

The IMC does in fact seem to work. Multiple researchers have found that excluding users who fail the IMC make it easier to detect statistically significant results. This is what we would expect if users who fail IMCs are in fact introducing more noise into the results via careless answers, as Krosnick originally hypothesized.

Including an IMC is not always the right move, though. Researchers Hauser & Schwarz (2015) have found that asking users an IMC question makes them think harder and longer about future questions than if they had not been asked an IMC question. So while IMCs can be useful for researchers who want to ensure that their participants are reading questions closely, they might not be useful for studies whose results could change based on how closely the participant is thinking about the questions they’re being asked.

If, for example, you’re trying to measure people’s immediate reactions to something (like a personal threat), then they might give more thoughtful and less knee-jerk responses after being asked an IMC. If you’re hoping to learn something about how people respond to threats, your data might no longer be trustworthy. So while IMCs can be useful, researchers should think twice before deciding to include them in a study.

Remote Usability Testing vs Lab Testing

I. Background and Methods
Laboratory usability testing – where a small group of users are brought into a lab and prompted to complete tasks while under observation from researchers – is an extremely tool for designers and researchers. It can also be extremely expensive, time-consuming, and a lot of trouble to schedule. What if it could be simplified?

Researchers Thomas Tullis, Stan Fleischman, Michelle McNulty, Carrie Cianchette, and Margerite Bergel conducted a study comparing lab testing (where users are brought into the lab) with remote usability testing [warning: download link to PDF]. The product being studied was a company HR website, and users were asked to complete certain tasks (like figuring out how to have $200 deposited automatically every month from one’s salary into a savings account).

Instead of having researchers on hand to collect data, the remote tests captured the user’s clicks and activity. The test also involved providing remote users with a small browser window open on the top of their computer screen so that users could give comments and feedback as the test progressed. The embedded image below shows how this looks.

uxblogredgreenhighlights.png

The green box indicates the website’ content, while the red box indicates the small browser window that participants use to give feedback and comments.


II. Results

29 users completed a remote test, while 8 users participated in lab testing. The two tests found no significant differences in task completion rates or average task duration time. Researchers asked participants from both groups about their subjective opinions on the website, and remote participants seemed to be harsher critics than lab participants. Remote participants gave more negative opinions on all but one of the 9 questions asked.

The authors have two possible explanations for this. The first is that it could be an artifact of the small sample sizes (29 v. 8). The second is that participants often feel badly when criticizing a product being tested, even if the people doing the testing didn’t create the product. The authors point mention that in their experience, some participants who are explicitly told that the testers are not the site designers still seem hesitant to offer criticism.

This is a valid point, and it could very well have been the problem. But the researchers conducted a second experiment that didn’t replicate the same pattern, and in fact found very little correlation between in-lab testing and remote testing. This makes sample sizes seem like a more likely culprit. Again, task performance and task data was roughly identical between the two different types of testing, and the authors conclude that quantitative data collected via remote testing is likely to be robust and reliable.

III. The (semi) bad news
The first experiment found that the 8 lab users identified 26 usability problems with the web site, while remote participants only identified 16 problems. 11 of those issues overlapped, 5 were identified only via remote testing, and 15 were found only via lab testing. Because identifying usability problems is one of the key goals of usability testing, this seems like a bad sign for remote testing.

But the authors’ second experiment involved a much larger sample size of remote testers (88 remote participants compared to 8 lab participants). In this experiment, the lab test identified 9 usability issues while the remote test identified 17, while 7 of the issues overlapped. The researchers conclude that this is likely a function of the large sample size: more participants means more opportunities to identify usability problems.

For researchers who are tempted to do away with cumbersome usability testing in favor of lightweight remote testing, these are interesting but mixed results. It seems that remote testing can sometimes do better than lab testing, but it usually requires larger sample sizes (sometimes much larger). And, unfortunately, the sample size at which a remote test can safely be assumed to be equivalent to a usability test is still nebulous. This study implies that for websites, this magic sample size is larger than 30 but smaller than 90, but beyond that we can’t really be sure.

These are positive results for remote testing, but they are cautiously positive rather than overwhelmingly positive. To my eye, they seem to indicate that remote testing is reliable for quantitative metrics and that it might potentially work as a substitute for lab testing if the sample size is large enough. But they also indicate that remote testing will often work better as a supplement to traditional user testing rather totally usurping it.
UX takeaways.

  • Face-to-face testing and remote testing might introduce different types of bias. For example, participants might be more likely to give positive answers during lab testing than during remote testing. Future research will hopefully examine this particular area in more depth.
  • Some percentage of remote users usually end up abandoning the survey before completion. This could bias the results, which researchers should consider if they are relying on a highly representative sample of users. For example is that users with less experience in a certain product domain might be less likely to finish a long remote usability test involving that product than users who have experience in that domain. This seems less likely to be a problem with laboratory testing where abandoning a session is much more complicated and consequently much rarer.
  • The sample size for lab testing is usually small enough that any quantitative data they produce (like subjective assessment data) is unlikely to be very robust.
  • Remote testing and lab testing often identify similar usability problems, but both methods often identify usability issues that the other did not find. This implies that the two methods of testing would supplement each other well for researchers trying to find an exhaustive list of usability issues.

Good Design vs. Good Targeting for Banner Ads

I. What Makes People More Likely to Notice Ads?

One way for ads to grab attention is to use emotionally charged content. This can be conscious, like those unfairly sad Thai life insurance commercials (warning: you will probably cry if you click this link). One inventive study demonstrated the effects of emotional content by showing different images to each eye at the same time. One image was neutral (e.g., a person looking at the camera with no expression) and one was emotionally charged (e.g., two people smiling and touching each other). Example:

Screen Shot 2018-04-19 at 4.18.19 PM

The researchers looked at which picture was perceived first by users’ visual systems and found that the emotionally charged pictures were actually processed first.

The authors of this study — Resnick and Albert — had previously found that users in studies were more likely to ignore banner advertisements if they were assigned tasks to complete on a website rather than simply browsing.

(Although the authors diligently note that another study by a different researcher had found that users trying to complete tasks and users “free browsing” were roughly equally likely to notice banner ads.)

Resnick & Albert wanted to see if they could catch users’ attention by varying the content or look of the advertisements in a non-intrusive way. For example, when using a search engine, users (not surprisingly) are more likely to pay attention to ads that matched the content they searched for. But people also report feeling suspicious and uncomfortable when ads are perceived as overly targeted. So personalized advertising has to walk a bit of a tightrope.

II. The Studies

Study 1

The first study looked at 30 users who were browsing in order to complete tasks. Half the users were shown banner ads that were relevant to the page (eg, an ad for running shoes on a jogging website), and half were shown irrelevant ads (eg, ads for toilet seats on a jogging website).

Resnick & Albert also showed ads to some users that had the styling and colors removed, making the ads much more plain. An example is below. While the screenshots below are black and white, you can see that the car advertisement in the top image has been modified to have its color and design elements removed.

Screen Shot 2018-04-19 at 5.30.26 PM.png

When the researchers looked at the designed ads and the plain ads and the relevant and irrelevant ads, they found no significant differences between the any of them (although some of the results seemed to be trending towards significance). The graph of results looks like this:

Screen Shot 2018-04-19 at 4.36.10 PM

We can see that non-contextual ads seem to be less effective, but the effect isn’t significant yet (indicated by the overlapping error bars on the top of each bar).  Contextual designed ads also seem like they might be a little more effective than contextual plain ads, but the difference isn’t statistically significant and the sample size is small enough that this could easily be coincidence.

Study 2
The researchers realized that they might need more relevant ads to catch users’ attention. Even if the ads were relevant to the page, they might not be relevant to the users’ tasks. So Resnick and Albert conducted a second study, this time with 50 users.

Again, users were given a task (“Learn about how to replace car parts,” for example) and shown a website. This time, users did dwell longer on task-relevant ads than irrelevant ads, and the effect was statistically significant. Interestingly, the difference between designed ads and plain ads is quite obviously zero.

Screen Shot 2018-04-19 at 4.43.07 PM

III. Takeaways
1. Designed Ads and Plain Ads Are Roughly Equally Effective At Drawing Attention
Neither study shows a large difference between how much attention users paid to designed ads vs. plain ads. Considering the amount of money spent on internet advertising — a significant amount of which goes presumably goes towards these aesthetics flourishes — these findings are fascinating.

It’s still possible that brands are more likely to be judged as high-quality if their ads are carefully designed rather than just plain text. But if it turns out that plain-text ads are just as effective as highly designed ads, then ad firms might be able to save themselves some money on future campaigns.

2. Targeting Websites is Probably Less Effective than Targeting Tasks
The effects might not be significant, but I’m not comfortable looking at the graph in Study 1 and concluding that website-relevant ads are no more effective than website-irrelevant ads. But the results in Study 2 are significant, which implies that task-relevant ads are the most effective kind of ad targeting.

UX Takeaways
It might not be totally responsible to extrapolate these results beyond banner advertisements. This paper doesn’t even examine all the facets of banner advertisement effectiveness. It’s possible, for example, that people look at plain ads and designed ads for equal lengths of time but are more persuaded by designed ads.

But this paper at the least suggests interesting avenues for future research. I’ve seen multiple products progress from idea to completion, and a regular point of debate is how much effort should go into aesthetics vs functionality at each stage. Many of these discussions take it as a given that aesthetics are valuable, and people regular cite popular wisdom about the importance of first impressions and the strength of our intuitive subjective judgements. These results suggest that that there might be some cases — like perhaps trying to complete a task while in a stimulus-heavy environment like the internet – functionality is far more important than design.

Loss Aversion Hit By Replication Crisis

I. What is Loss Aversion?

A new paper out in the journal Psychological Research suggests that Kahneman & Tversky may have overestimated the effects of loss aversion.

(Loss aversion is the idea that people consider losses more emotionally noteworthy than gains, even when the amount being lost or gained is identical. For example, if you lose $10, you’ll be really angry. But if you find $10 on the ground, you’ll only be moderately happy).

Loss aversion has been a popular idea ever since Daniel Kahneman and Amos Tversky discovered it decades ago, even boasting its own (long) wikipedia page. But it’s also been quietly under fire for a while, and this paper’s author, Eldad Yechiam, is clearly skeptical. Yechiam’s literature review finds that loss aversion might exist for large amounts ($500+), but probably doesn’t apply to smaller amounts ($100 or less). Even when loss aversion is found, it doesn’t necessarily seem to reflect irrational or biased thinking.

II. How did the original studies get it wrong?

Yechiam identifies the following problems with loss aversion:

1. People react differently to winning and losing even when no loss aversion is found.

Even when people are put in situations where they don’t experience loss aversion, losing still has different physiological effects on the body than winning. For example, people’s heart rate increases and their pupils dilate more when they lose a certain amount than when they win that same amount, even in situations where most people don’t experience loss aversion. When asked to choose between different outcome probabilities, people sometimes take longer to respond to scenarios involving loss than scenarios involving an equivalent amount of gain. And risk and value appear to be calculated by different parts of the brain.

2. The early results that supposedly demonstrated loss aversion didn’t actually demonstrate loss aversion.

This one is a bit embarrassing. The Galenter & Pliner paper that Kahneman & Tversky cite to show the existence of loss aversion actually didn’t find it. Galenter & Plinter say that they expected to find a stronger preferences for avoiding loss than seeking gain, but didn’t.

Looking closely at a 1979 review by Fishburn & Kochenberger — which also supposedly identified loss aversion — reveals that Fishburn & Kochenberger transformed everyone’s data based on a complicated justification involving their wish to compare different individuals with different utility functions against each other. The transformations muddy the waters enough that the data is probably too suspect to be taken as a straightforward confirmation of loss aversion.

Also, a lot of the studies that Fishburn and Kochenberger review seem less that perfectly trustworthy. One study interviewed supposedly interviewed about a hundred executives and only presented the results for 7. Another interviewed 16 people and presented the results for 4 of them. Obviously, this kind of cherry-picking is not usually a great sign that your findings will replicate.

3. Some of the early studies were asking people about very large potential gains and losses

Everyone already knows that big losses are considered extra-bad, because “below certain cut-off points, negative outcomes can carry a future cost that is heavier than the direct immediate penalty, such as the change of future economic ruin.” In other words, “loss aversion” isn’t necessarily irrational. People might just be correctly perceiving that losing $1,000 really would be worse than gaining $1,000.

If I lose $1,000 and can’t make rent, I might become homeless, or my credit might go way down, or I might lose my rainy day fund and not be able to fix my car if it breaks down. Losing $1,000 can ruin your life, if it happens at a bad time. If I gain $1,000, by comparison, I would probably feel super great about it, but it’s unlikely that my life suddenly takes a massive upturn. It’s probably just an extra $1,000.

So in this case, I seem to be experiencing “loss aversion.” But if you look closer, I’m simply acting rationally. I understand that losing $1,000 might ruin my life, and also that gaining $1,000 is unlikely to supercharge my life, so I weight the two outcomes accordingly. I am risk-averse (I avoid big risks), but I am not loss-averse (I don’t avoid risks of all sizes).

Therefore, the finding that people don’t like to gamble when huge amounts of money are at stake doesn’t really need a new theory like loss aversion to explain it.

So how much money needs to be at stake for this risk aversion to kick in? The authors cite this very long 2013 review by Yechiam and Hochman, and conclude that anything under $100 probably won’t trigger significant risk aversion in the average study participant. They find that these results hold when real money is used.

4. Some of the early studies were asking people about decisions made at work that affected their company’s finances rather than their own finances.

(I should add a disclaimer that this isn’t mentioned in the 2018 Yechiam review, but I think it’s worth pointing out anyway].

It makes sense that people face different incentives at work than they do in their personal lives. One common argument against bureaucracy is that people are too incentivized to pick safe choices and not incentivized to take risky choices. If a risky choice pays off, your boss might give you an approving thumbs-up and think slightly higher of you; if a risky choice fails, you might be fired. Hence the business proverb “no one ever got fired for choosing IBM.

If we’re trying to evaluate how people respond to risks and rewards, it probably doesn’t make sense to ask them about work (where they might be subject to complicated incentives or disincentives that we can’t see). It makes more sense to ask them about their personal lives.

III. What’s left for loss aversion

It’s not all bad for Kahneman and Tversky, or for loss aversion in general.

1. The reflection and framing effects that they identified seem to replicate pretty well (as demonstrated in this recent meta-analysis). 

2. The results that loss aversion predicts — that people will avoid high-variance bets with low expected pay-offs because of the potential negative effects  — are indeed found when the amounts of money at stake are large. This might not be due to biased and irrational thinking, as first proposed, but it’s still a valid result.

3. People do really seem to have larger reactions to (even small) losses than gains, as evidenced by physiological studies focusing on e.g. heart rate or pupil dilation. Now, this is true even in conditions where loss aversion is low, so it probably isn’t directly due to loss aversion as Kahneman & Tversky understood it. But it’s still evidence that they were partially correct, and that people seem to respond to losses more intensely than gains, at least in certain ways.

4. Losses appear to increase attention more than gains, even when the losses are fixed and don’t reflect participant performance. This implies that something about the act of loss has interesting impacts on human performance.

So Kahneman & Tversky correctly intuited that something interesting was going on when it came to the effects of losses as compared to gains. But the model that they produced to explain their findings seems to have been flawed. This isn’t surprising, and it’s nice to see diligent researchers carrying on in their wake.

TAKEAWAY FOR UX RESEARCHERS

  • Loss aversion might exist for large amounts ($500+), but probably doesn’t apply to smaller amounts ($100 or less). 
  • Even when loss aversion is found, it doesn’t necessarily seem to reflect irrational or biased thinking. People are justifiably more worried about huge losses (which can ruin your life) than huge gains (which can definitely be great, but probably not as great as ruining your life would be terrible).
  • Replication and framing effects seem to be holding up (for now).
  • Losses do seem to focus attention and increase arousal more than gains.

Note: all links in the above blog post were cited by Yechiam in his paper in Psychological Research, with the exception of the Wikipedia link on loss aversion.